Tesla Neat - My Comparison Between Tesla and ICE Cars
Introduction
As mentioned in another post, I’m also curious as to the savings, or lack of savings, from EV (specifically Tesla) ownership. If you haven’t read the post I’m referring to, feel free to check it out here. In that post, you can see the total cost of charging ($297) based on my experiences. I’ve owned the car (2020 Tesla Model 3 SR+) for about eight months or so and have since clocked a lifetime-to-date odometer reading of 7,862 miles.
The largest claim, and one I made myself, is that electric vehicles save you money over ICE (internal combustion engine), or gas, vehicles. I’m curious as to whether 1) the car has saved me money comparing gas to electricity and 2) the comparative carbon footprint and environmental impact. Let’s see what the data says.
Background and Assumptions
I’ll compare the 2020 Tesla Model 3 SR+ against:
- A comparable small/mid-sized luxury sedan per here: 2020 BMW 330i,
- My previous car: 2013 Toyota Rav4 LE,
- My sister’s car: 2020 Audi Q3,
- A car I was looking at: 2020 Toyota Corolla Hatchback XSE,
- A fuel-efficient gas car: 2020 Toyota Prius Limited, and
- Another car I was also looking at: 2020 Rav4 Hybrid XLE.
I’ll admit, these might not be the most comparable vehicles (aside from the 330i), but this analysis takes a more practical approach. These are cars I was looking at and so these are expenses I would’ve incurred, not necessarily what the industry is benchmarking against the Model 3.
Prior to diving into the data, let’s see the metrics for each vehicle. For purposes of MPG, I’ll take the average of the city and highway metrics unless the combined MPG is provided, which I will then use. I only pulled key power metrics - HP, MPG (city/highway/combined), and tank size. There are of course other metrics to analyze further, as external conditions (e.g., weather) or other car-specific elements (e.g., tires or aerodynamics) may play a role in fuel efficiency and range.

Analysis
I’ll segment this post into two key parts: power and emissions, starting with power.
Power
My main question is whether I’ve saved money driving an EV. This is the clear difference between the car and the benchmarks, the Tesla uses electricity as it’s power source whereas the benchmarks use gasoline. My initial hypothesis, albeit a slightly biased one, is that I’ve saved money on the power source aspect of the car. My car is far from the most efficient, as it’s the base model, but I still expect it to net to a comparative cost savings. I’ll specifically look at the cost of electricity and the cost of gasoline over my odometer reading.
An important assumption I’ll make is that the cost of gas is consistent across the entire year (2020). From the great folks over at AAA, I was able to source average annual gas prices by gasoline type in TN. The source data can be found here. Using that source, as pulled from 1/1/2021, the LTM average regular unleaded and premium unleaded cost per gallon were $2.4/gal and $3.0/gal, respectively.
I then multiplied the MPG Combined with the Tank Size to get the car’s Effective Range in miles. Again, this range is dependent on a variety of conditions so this analysis pulls what would be listed on the car’s sticker. I then used my LTD odometer reading of 7,862 miles and divided it by the Effective Range to calculate the Total Fill-Ups which represents how many times you’d fill up the car to reach the same odometer reading assuming the car achieves it’s specified range. I then calculated the “Odometer Cost”, as I’ve dubbed it, which is the product of the Total Fill-Ups, Average Cost per Gal, and Tank Size. This field is the cost of achieving the same odometer reading (7,862 miles) given the car achieves its specified range, the tank size specific to the car, and the average LTM cost of gasoline in the state of TN. The final calculated field is the Multiple which is the Odometer Cost divided by $297, or the LTD charging cost per my other post here. The Multiple field is much easier to comprehend as you can view it as “it would cost me #.#x more to drive [car] vs the Model 3 SR+”. The image below is the calculations as mentioned in the text above. It’s clear that the fuel efficiency of the Prius (1.2x) and Rav4 Hybrid (1.6x) equate to multiples much closer to the Model 3 than the 330i (2.6x) or the Q3 (2.9x).

But…that’s obvious right? It’s what I expected in my hypothesis, it’s how EVs are marketed, and it’s what is expected from alternative energy industry. Taking a look at a simple linear regression of Odometer Cost versus MPG Combined, Tank Size, and Effective Range, you can see that these factors are moderately-to-strongly positively correlated. For these correlations, I removed the Model 3 as it’s a clear outlier.
The important considerations span beyond the specifications of the power train of the vehicle. There are intangibles to consider that can and can’t be quantified. A non-exhaustive list of these include the following…
Time
This is the most important aspect for me. When I go on extended trips, I add a buffer of 30-45 minutes for every 1.5-hour span of driving. This is based on my driving style and my personal experiences, but I’m willing to bet it varies for others. To combat this, I merge my driving breaks with my charging breaks. If I was planning to stop for food, I’ll grab it before I charge and eat while I charge. The same goes for bathroom breaks, as superchargers are near gas stations or supermarkets. If you can quantify your time in terms of costs, i.e., drive time means less income, then this factor may be more important for you.
Range
This was the next most important factor for me. The Model 3 SR+ I have is rated for a range of 250 miles. There was a refresh for second-half Model 3 that increased the range to 263 miles. 250 miles is low…really low. My previous car, the 2013 Rav4, had a longer effective range despite being 7 years older. I only had to stop once, if at all, when travelling from Nashville, TN to Cincinnati, OH. When driving the Model 3, I stop in Bowling Green, KY then again in Louisville, KY then again when I arrive in Cincinnati, OH (so I can have more than 20~% charge when I reach my destination). This turns a 4.5 to 5-hour trip in a 6-hour trip. The range follows the same concept of time, for me, it’s a trade-off I’m fine with making as I can plan accordingly. For others, this may not be the case. The Model 3 includes charging stops if your trip length exceeds your car range. Another tool is using A Better Route Planner (“ABRP”) which shows charging stops and how long you need to charge for given your starting percentage and desired ending percentage. I usually look at ABRP to get an idea of where I need to stop, but I usually set my destination from supercharger-to-supercharger in 1.5 to 2-hour travel increments.
Convenience
Similarly, this follows the range factor. Superchargers are found in nearly every major city, and from my experience, within 1.5 hours from another supercharger. But what if you wanted to go somewhere off-grid such as a national park or a campsite? This past year my family and I took my car from Cincinnati, OH to various northern parts outside of Columbus, OH. We didn’t have the time to stop at a charger between destinations, so we charged once before leaving and then once after all the stops. I had to turn off the A/C during the tail-end of the trip and disable sentry mode when I was parked.
During another trip, my family traveled to the Great Smoky Mountains National Park in northeast TN. I wasn’t the one driving, but I assessed it as if I did. I noticed that there was a charger (non-Tesla, level 2) there, but it didn’t look like it was functioning. Plus, there were no chargers from our starting and ending locations. However, there are usually level 2 chargers scattered throughout the US. These may not be at the hotel where you’re staying, but they are often nearby. I use the PlugShare app on my phone to see these chargers in case I need to charge. The argument here, however, is that Tesla superchargers are popping up everywhere. In my hometown, there are three superchargers nearby, two of which within 15-20 minutes from my house. To me, it’s convenient enough to justify owning the Model 3, for others, it may not (can you see the trend here?).
There are other factors, such as the car itself. If you’re not in the market for compact car, you wouldn’t even consider the Model 3 as an option. Based on my own research, I was able to justify the factors I valued to land with the Model 3. For all the power-related visualizations, see the Tableau story below.
Emissions
Now, let’s look at the emissions savings. The hypothesis, like the power analysis, is that EVs, specifically the Model 3, has a smaller carbon footprint compared to the other benchmark vehicles. Again, I’ll admit this is seemingly obvious.
After some research, emissions are tracked by the US Department of Energy (“US DOE”)’s Office of Energy Efficiency and Renewable Energy on their site fueleconomy.com. Here, you’re able to filter for year, makes, and models for vehicles to see the annual petroleum consumption and greenhouse gas emissions.
The annual petroleum consumption is reported in number of barrels where one barrel is equal to 42 gallons. It’s further separated by US barrel and imported barrel. Greenhouse gas emission (“GHG”) is reported in grams per mile. This is further disaggregated by tailpipe GHGs and upstream GHGs. Per the US Department of Energy, the GHG figure is based on their departmental model and “includes the three major greenhouse gases emitted by motor vehicles: CO2, nitrous oxide, and methane”.
The US DOE provides further information to understand the differences between tailpipe and upstream GHG emissions. The definitions, as sourced from the US DOE, are as follows:
Vehicle Tailpipe Emissions: the greenhouse gas emissions your car produces when driving. Fully electric vehicles (EVs) have zero tailpipe emissions, while plug-in hybrid electric vehicles (PHEVs) emit greenhouse gases only when gasoline is being used to power the vehicle.
Upstream Emissions: the emissions associated with the production and distribution of gasoline and electricity. This includes activity like feedstock extraction (e.g., drilling for oil or mining coal), feedstock transport to a processing plant, and conversion of feedstock to motor fuel or electricity, and the distribution of the motor fuel or electricity. Electricity emissions depend on the mix of feedstocks used to generate electricity in your region.
Additionally, to better understand the source of emissions, specifically for EVs but also useful for understanding what upstream means, see the image from the US DOE below.
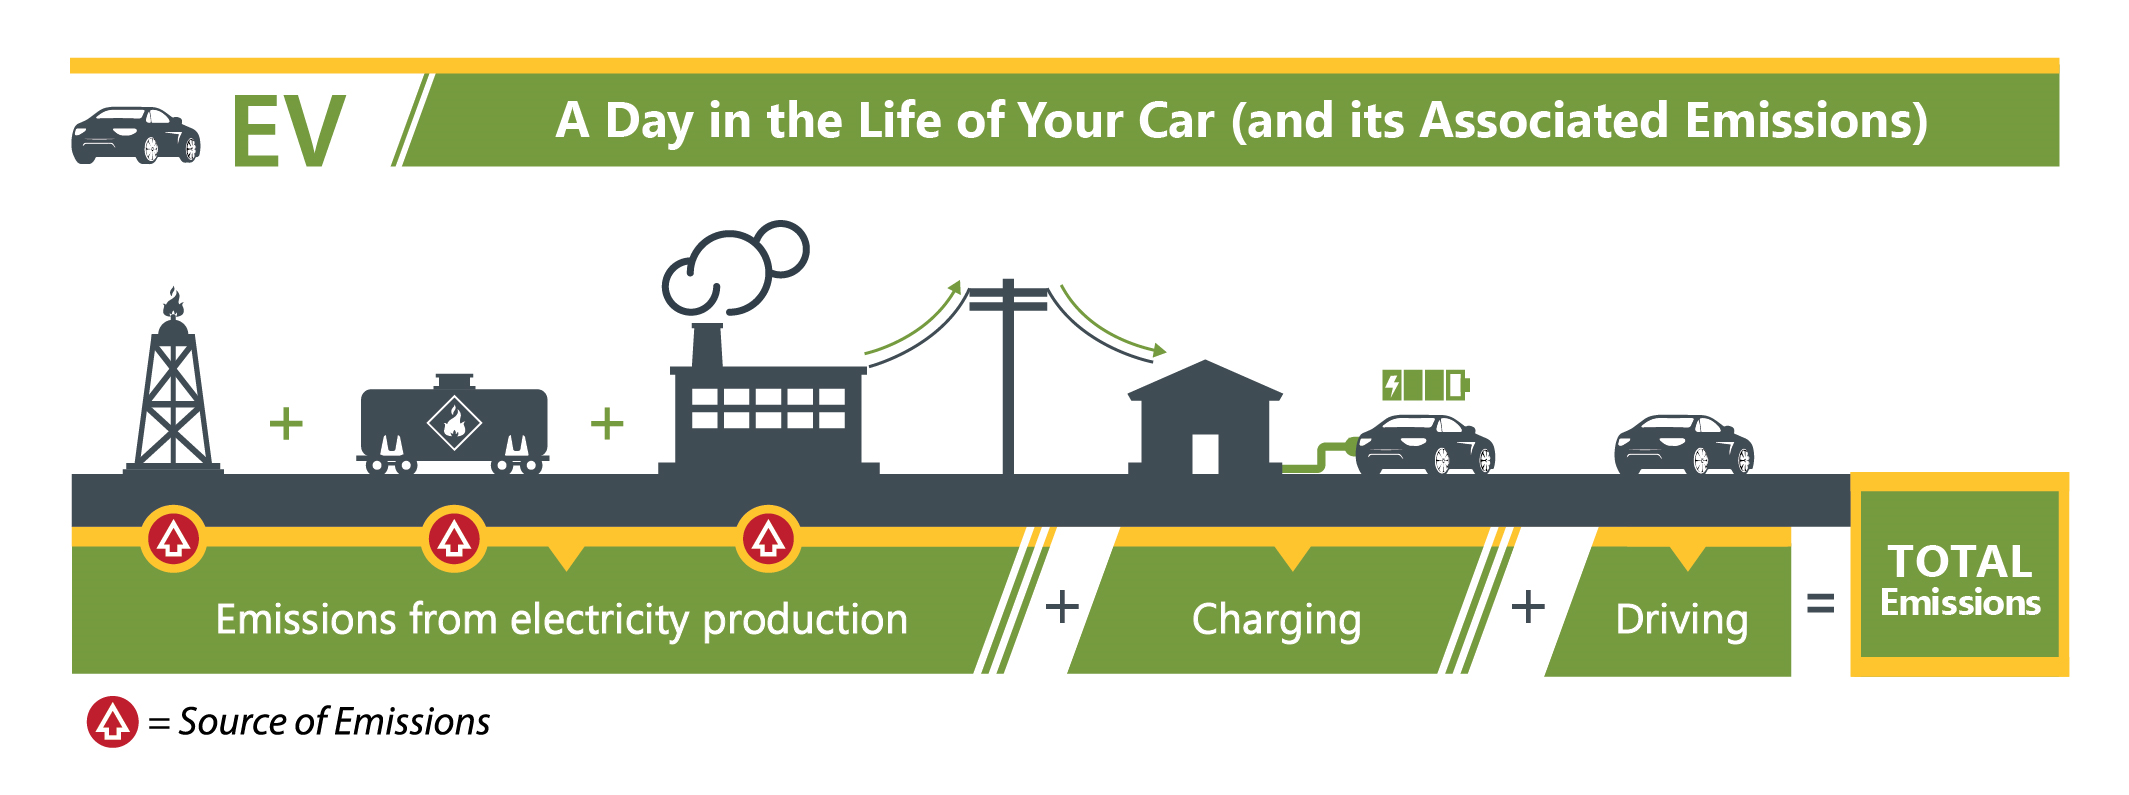
The upstream emissions are largely location specific and depends on how your local area produces the energy used in your vehicle. The US DOE provides a tool that allows users to input their vehicle and zip code and see the local, US average, and average gasoline emissions for comparison.
Per the US Environmental Protection Agency (“EPA”), the transportation industry is the largest source of greenhouse emissions with a share of 28% in 2018. The next largest category? Electricity production. As vehicle makers shift from ICE vehicles to electric vehicles, we can expect the transportation share to decrease (i.e., tailpipe emissions), but the electricity production (i.e., upstream emissions) share to increase, holding all else equal. The solution is efficient, yet environmentally friendly sources of electricity production, i.e., those that don’t require burning fossil fuels.
I’m far from fully informed regarding the renewable energy industry, but it’s clear that moving to electric vehicles is the right industry trend…and here’s why.
I used the data provided by the US DOE to source the emissions information for each vehicle in this analysis. Aggregating the original data produces the following table.

The US DOE uses assumptions to determine the Annual Petroleum Consumption, mainly, that one year of consumption is equivalent to 15,000 miles driven. Given my power analysis above, and to stay apples-to-apples, I’ve scaled the consumption to reflect my odometer reading of 7,862 miles. For emissions, the US DOE provides both tailpipe and upstream emissions grams per mile for each vehicle, which I also sourced. I then calculated the amount of greenhouse gas emissions for each vehicle both disaggregated by tailpipe and upstream, and in total.
The Model 3 had the highest Upstream GHG rate compared to the other vehicles at 120 g/mi. Keep in mind this is the rate for my zip code whereas the US average is 110 g/mi. Despite this, the Model 3 had the lowest Total GHG emissions as the tailpipe emissions are 0, given the car is fully electric. In fact, the next closest vehicle in the benchmark? The Toyota Prius with a multiple of 1.7x relative to the Tesla. The highest multiples were 4.0x and 3.4x for the Q3 and 2013 Rav4, respectively. The multiple factor is read in a similar way to that in the power analysis. In other words, read it as the [car] has #.#x more greenhouse gas emissions than the Model 3. You can see the calculations in the image below.

Looking at scatterplots between the Odometer Cost, from the power analysis, versus the Adjusted Petroleum Consumption, Tailpipe GHGs, Upstream GHGs, and Total GHGs, we can see a strong positive correlation in the four factors. To better understand this, my analysis, given my assumptions and benchmarks, displays the fact that vehicles with a smaller environmental footprint have a lower total cost to drive.
See the all emission related visualizations in the Tableau story below.
Conclusion
Though I looked at the power and emissions separately, the scatter analysis in the emission analysis ties it all together. If you’re looking for a vehicle with a smaller carbon footprint, lower cost to drive, and lower petroleum consumption…go EV as the Tesla in my analysis is the clear winner. If you’re not sold on EVs, then the next best option is to go with the most fuel-efficient ICE vehicle, such as a Prius. It’s important to note that I didn’t analyze plug-in electric hybrid vehicles, but my intuition tells me it’s somewhere between the most fuel-efficient ICE car and EVs.
Thus, the “hierarchy” from best to worst would be EVs, PHEVs, ICE cars. But there are so many more factors to consider, such as time, range, convenience, etc. When considering cars, ensure that these factors, and others, are weighed to make the most informed decision. One thing is for sure, my hypotheses, given my assumptions and benchmarks, holds true: 1) my car, a 2020 Tesla Model 3 SR+, is cheaper to drive and 2) my car also has a smaller environmental impact.
Sources
- https://www.epa.gov/ghgemissions/sources-greenhouse-gas-emissions#:~:text=Carbon%20dioxide%20(CO2)%20makes,natural%20gas%2C%20to%20produce%20electricity.
- https://www.fueleconomy.gov/
- https://www.evspecifications.com/en/model/cc48e0
- https://www.cars.com/research/toyota-rav4-2013/specs/usc30tos111a0/
- https://www.cars.com/research/audi-q3-2020/specs/usd00aus052a0/
- https://www.cars.com/research/toyota-rav4_hybrid-2020/specs/usd00tos202f0/
- https://www.cars.com/research/toyota-corolla_hatchback-2020/specs/usd00toc331d0/
- https://www.cars.com/research/bmw-330-2020/specs/usd00bmc223b0/
- https://www.cars.com/research/toyota-prius-2020/specs/usd00toc161d0/
- https://gasprices.aaa.com/?state=TN